Back to projects

FlowBoard: the tracker I run my own work on.

A developer-native alternative to Jira. Kanban boards with drag-and-drop, epics, sprint planning, velocity and burndown charts, and a cumulative flow diagram. The API is ASP.NET Core 10 written against raw SQL, deliberately with no ORM, so the queries are the part worth reading.

Role
Solo · Architecture + Engineering
Status
Self-hosted · source on GitHub
Stack
ASP.NET Core 10 · React 18 · Postgres
Notable
Raw SQL, no EF · SignalR realtime · tsvector search
The product

A board that loads fast and stays in sync.

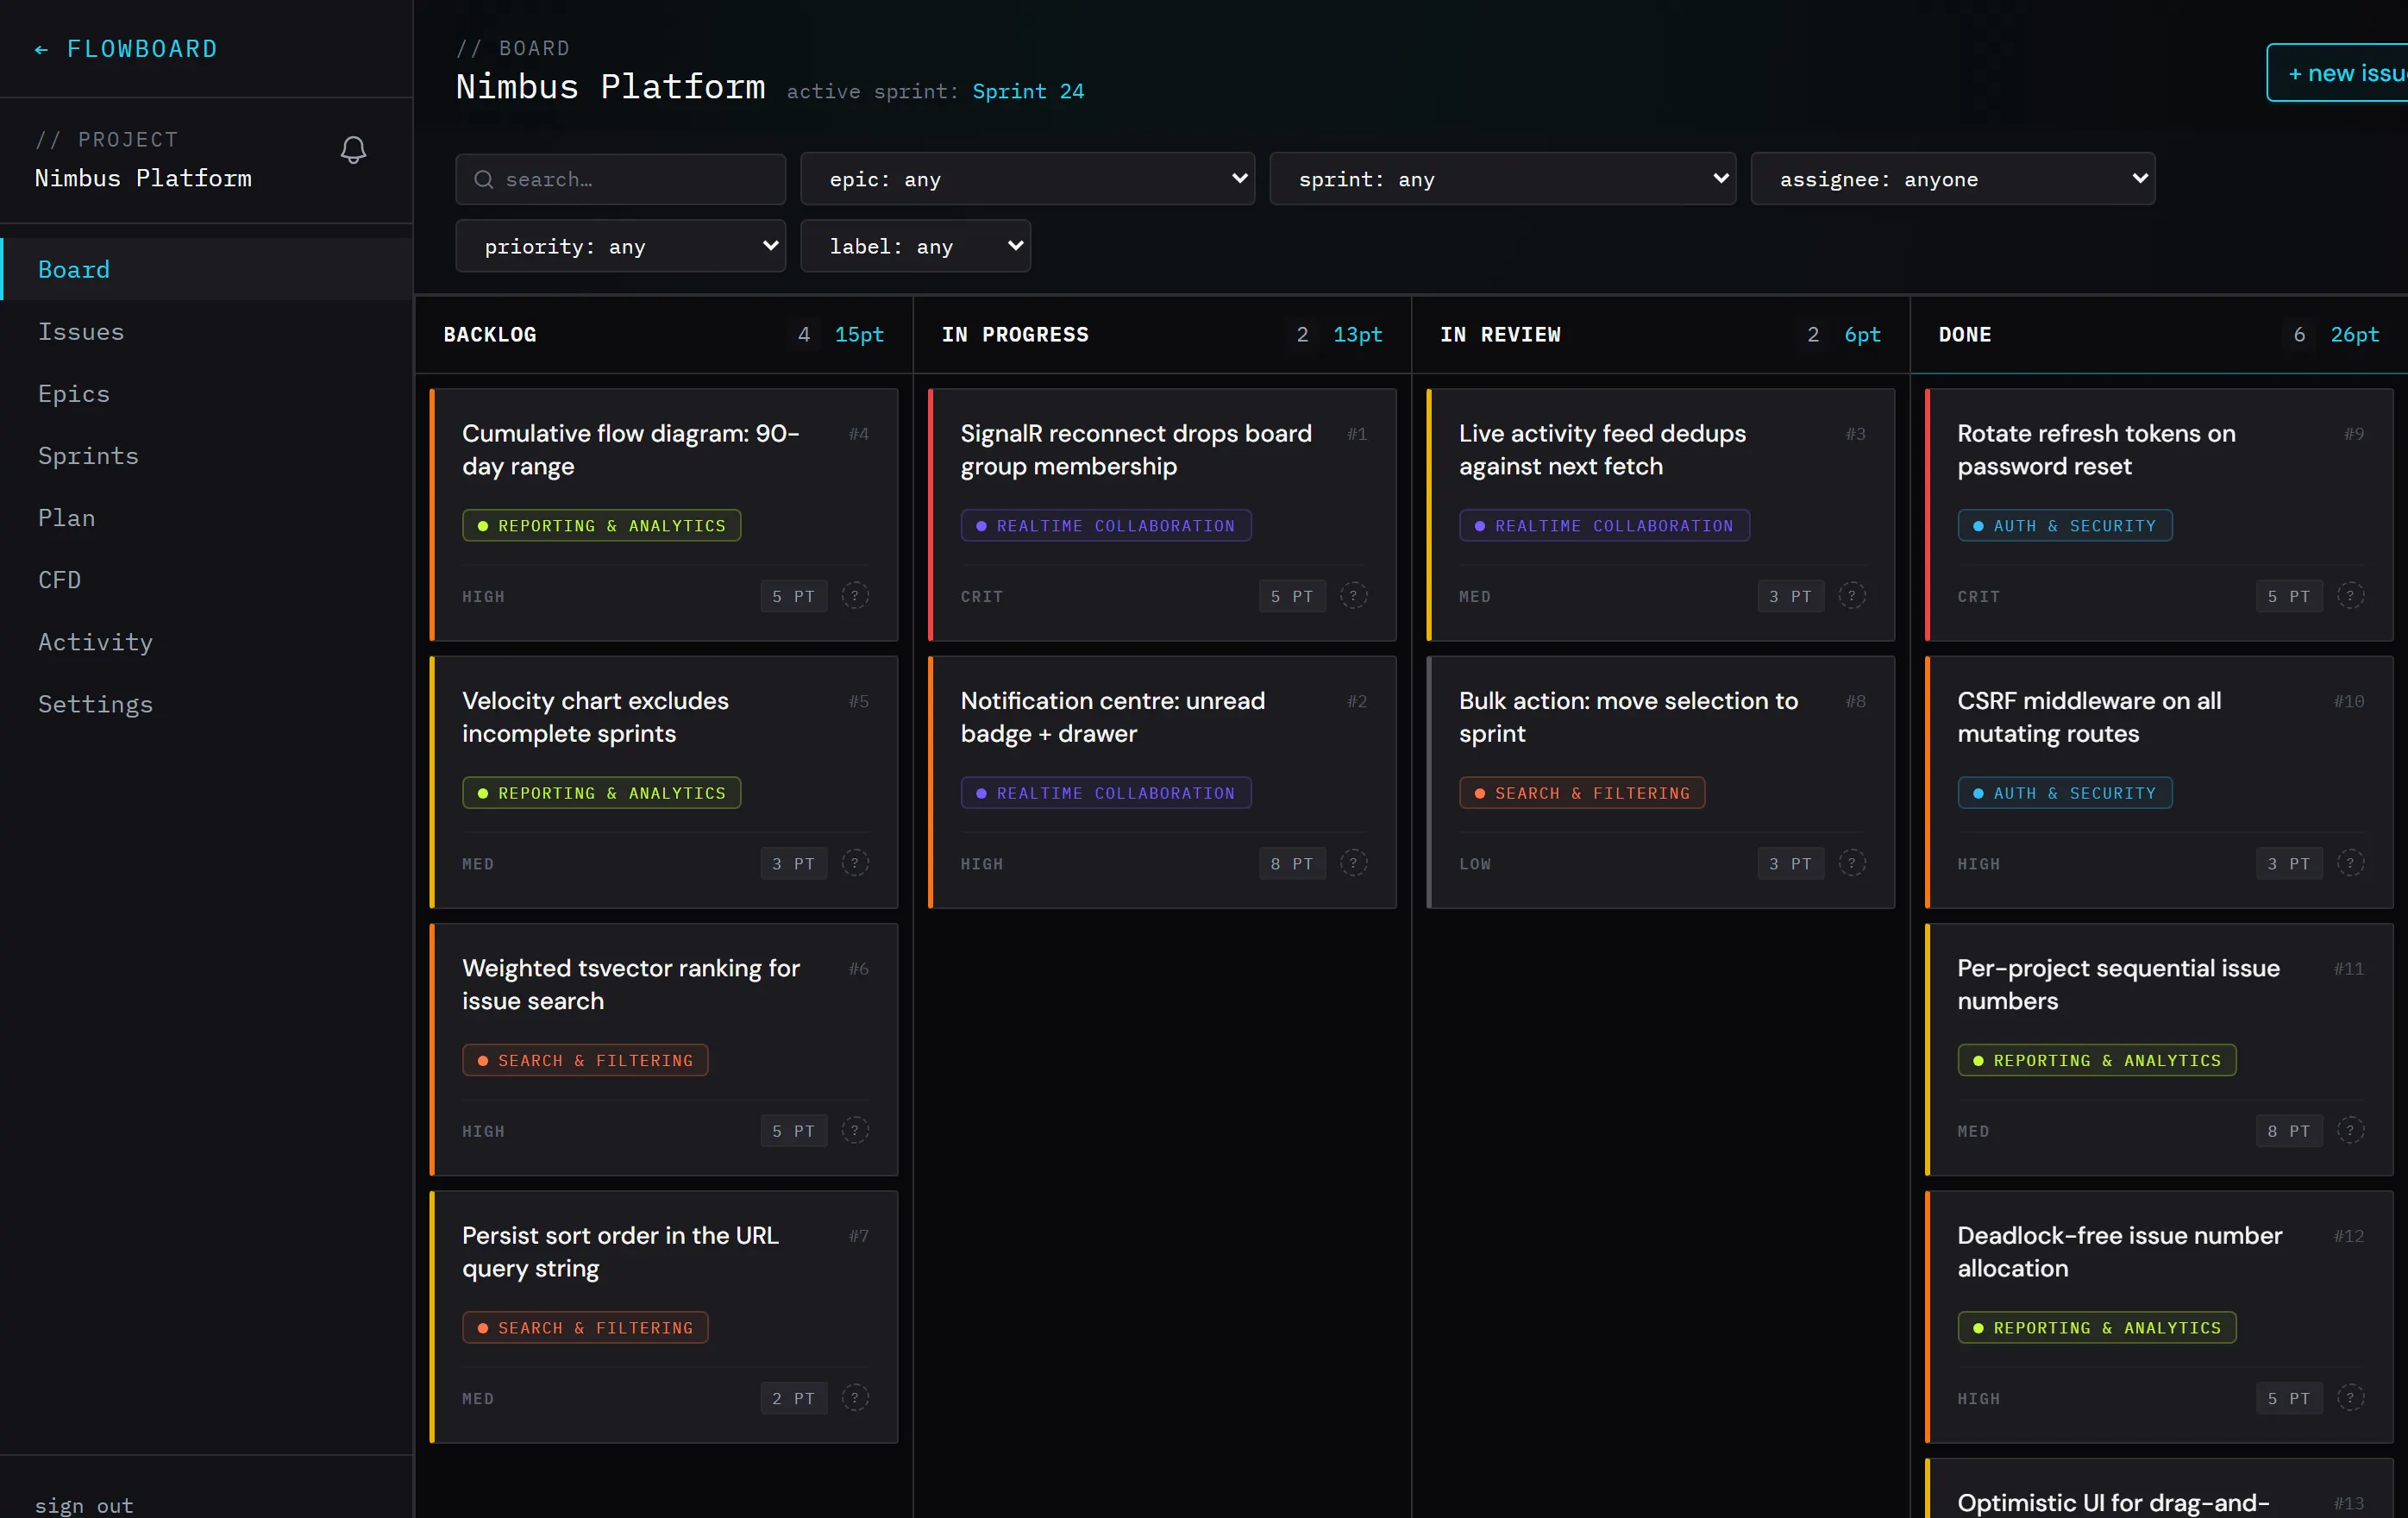
Columns, story points and epic pills, all drag-and-drop with optimistic UI. Every issue carries a per-project number that starts at #1 for each project, so the ids stay short and human. When a card moves, connected clients update over SignalR instead of waiting for a refresh.

FlowBoard kanban board showing Backlog, In Progress, In Review and Done columns with epic pills and story points
Board view · per-column point totals, epic pills, priority and story points
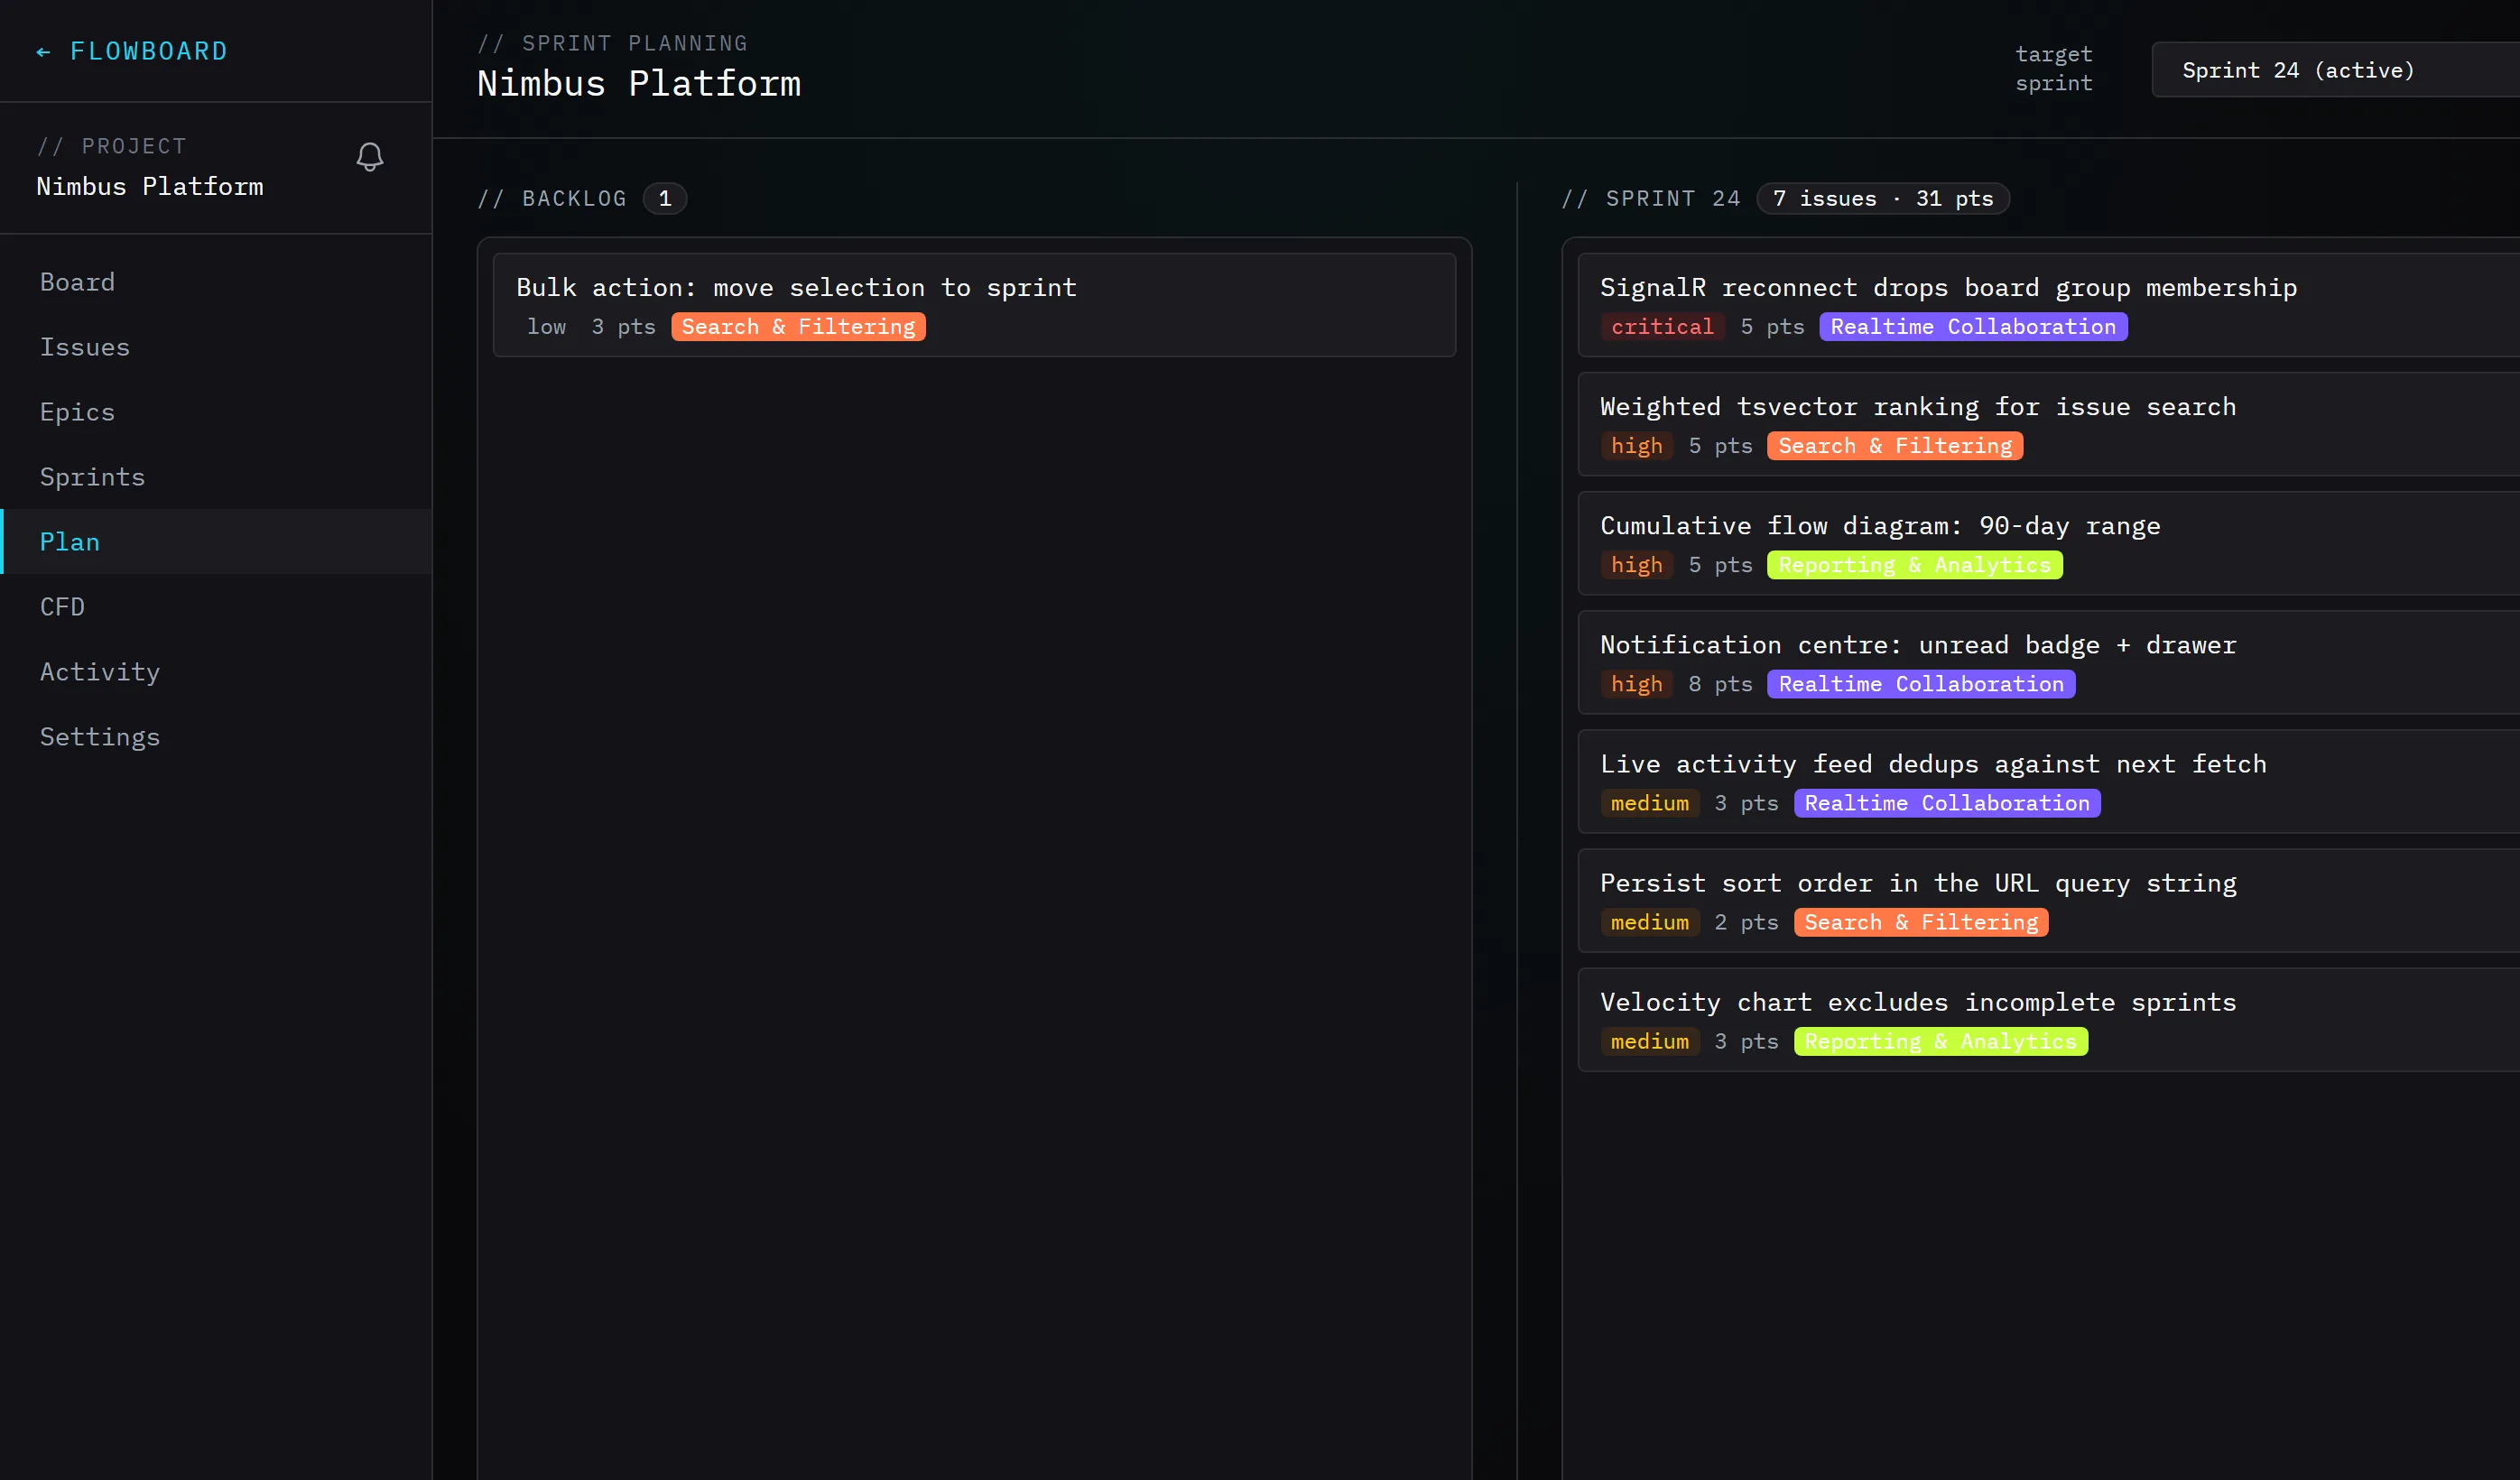
Sprint planning view with a backlog column and the active sprint side by side
Sprint planning · drag between backlog and sprint
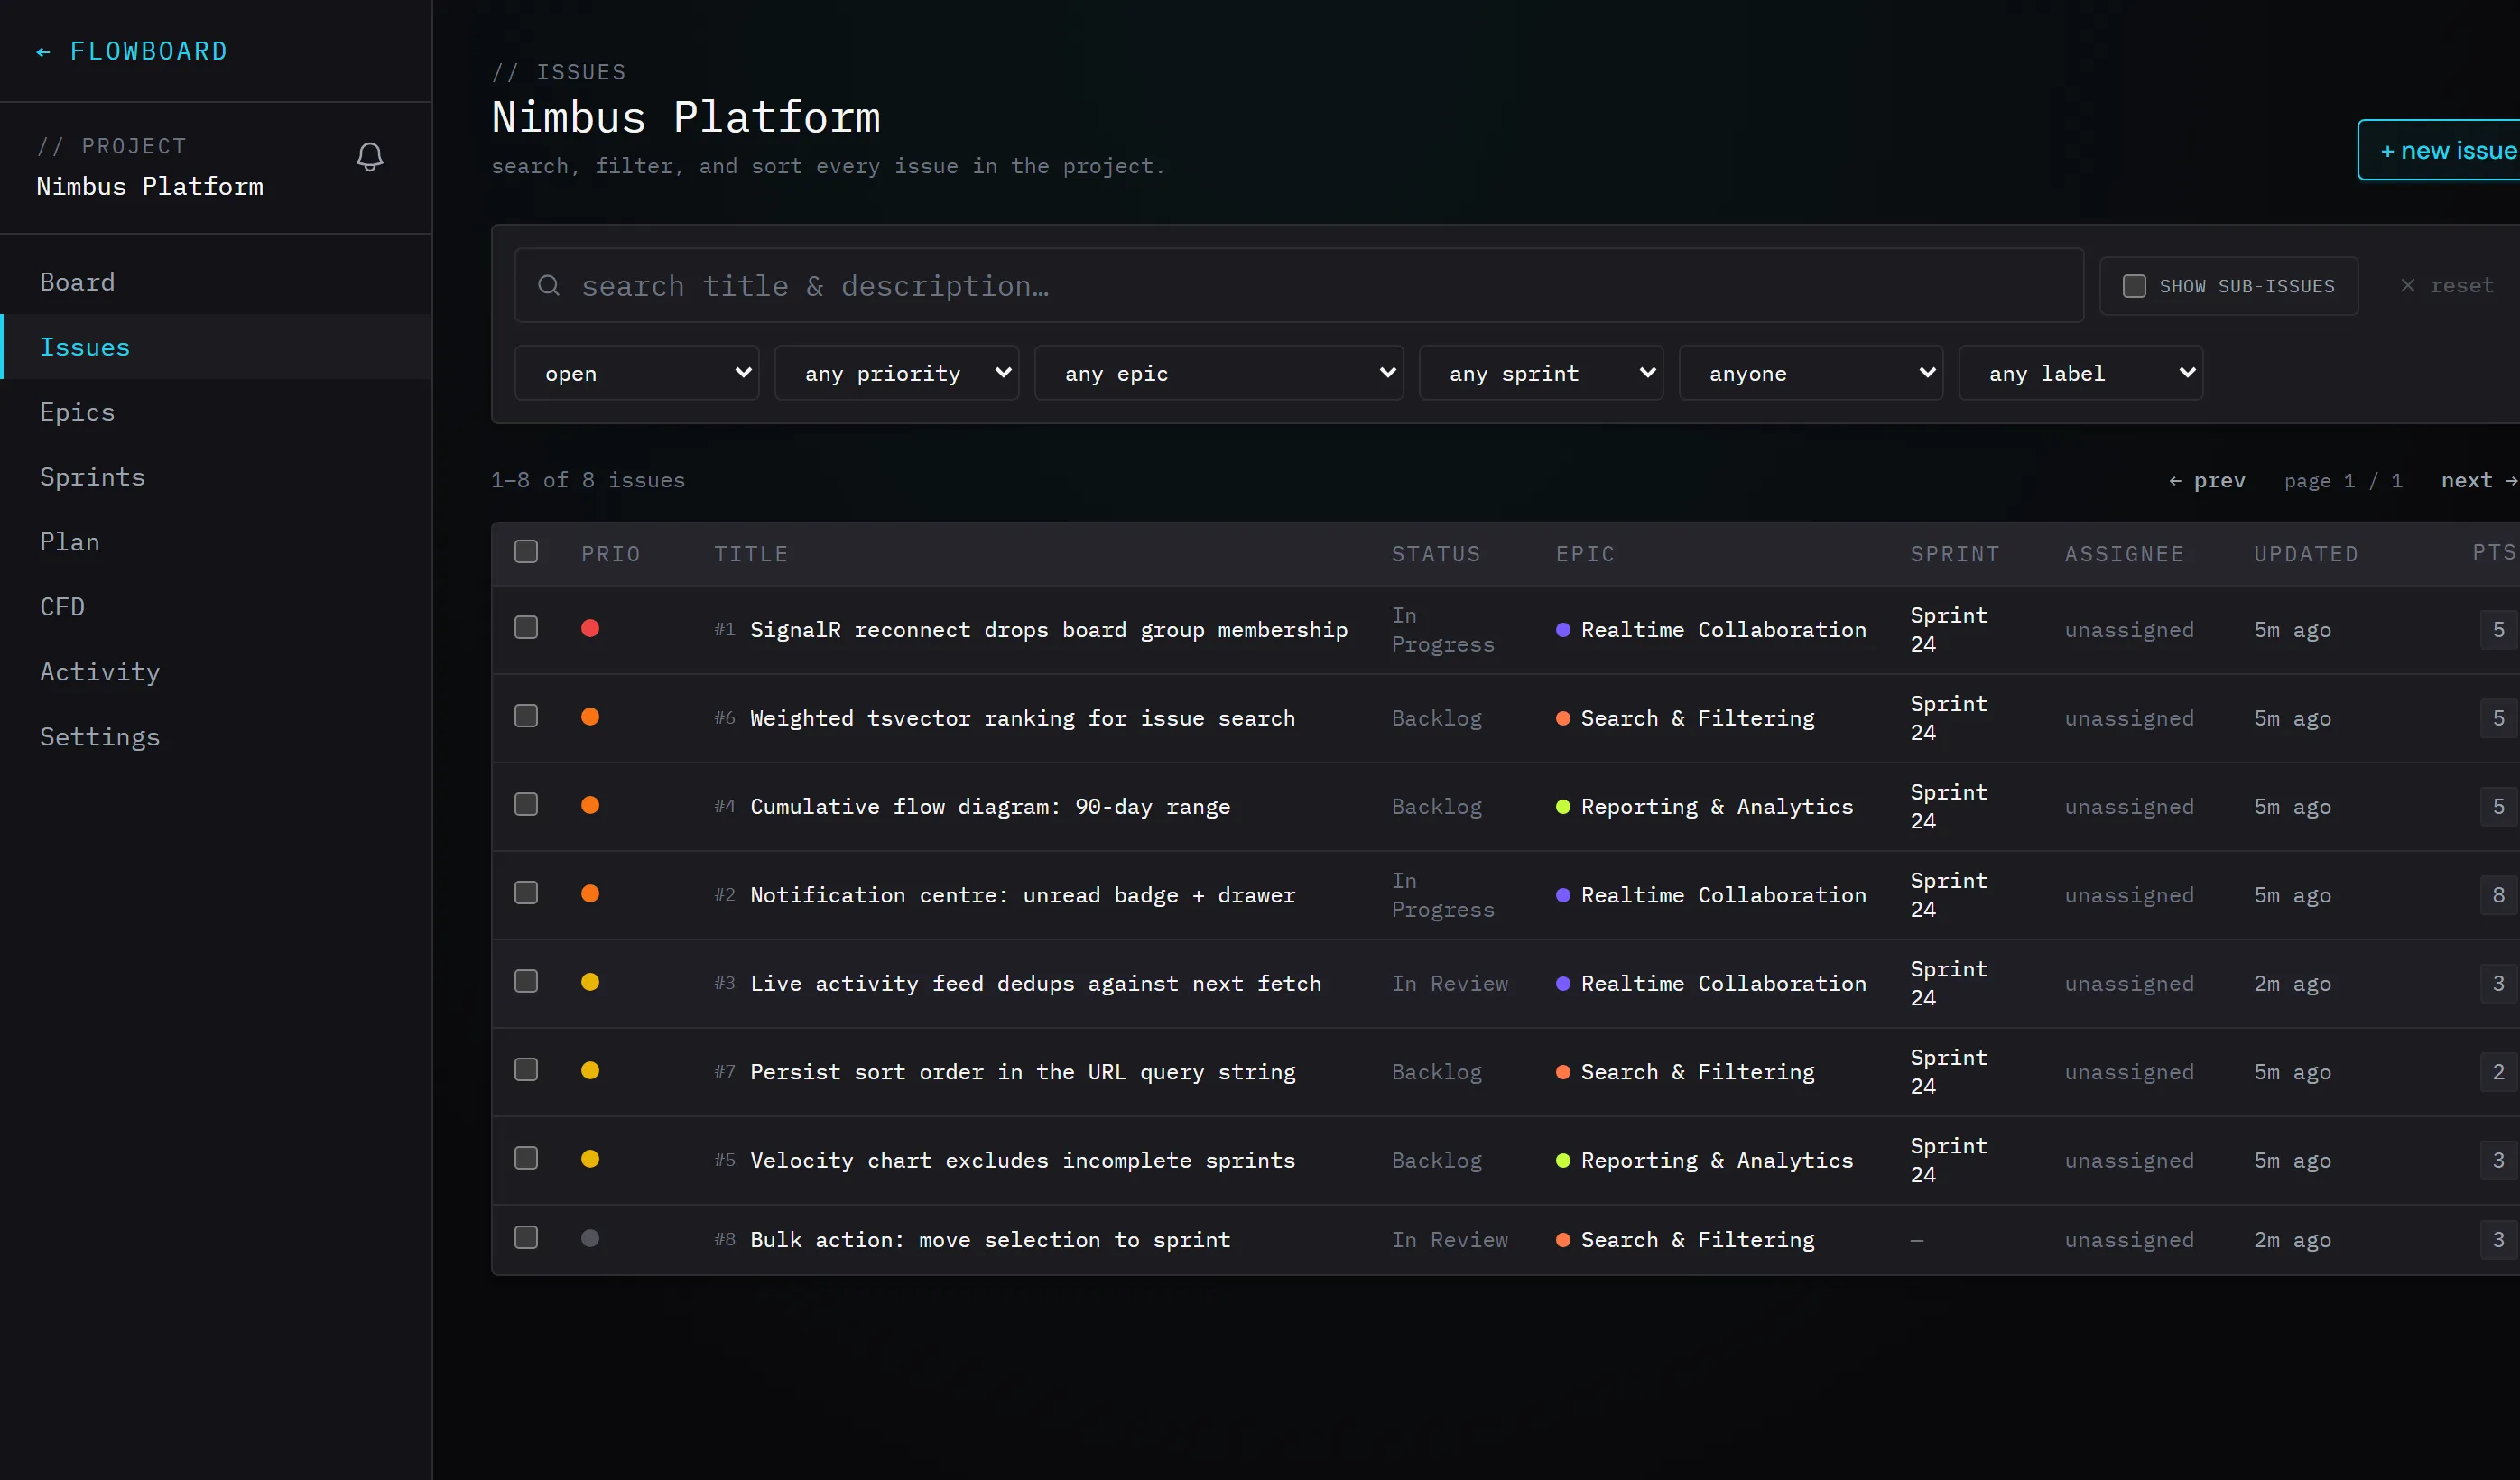
Issue table with search, filters, sortable columns and pagination
Issues · filters and sort order live in the URL
Why I built it

I wanted a portfolio piece that was actually load-bearing.

My day job is .NET, C# and SQL, and none of that work is public. A toy CRUD app would not have shown much, so I built the tool I would have to live with: FlowBoard runs on my own machine and holds its own backlog. Every feature on it exists because I hit the gap while using it.

That constraint kept the scope honest. Bulk actions exist because triaging a dozen issues one at a time was tedious. The notification centre exists because I kept missing replies. The cumulative flow diagram exists because I wanted to see where work was piling up, and a bar chart would not have told me.

The stack

Raw SQL, on purpose, all the way down.

There is no Entity Framework here, and that is the point. Every query is hand-written SQL executed through Dapper and Npgsql, so the interesting work stays visible instead of disappearing behind an expression tree.

API

ASP.NET Core 10 Web API. Dapper and Npgsql over Postgres, no ORM. JWT auth with 15 minute access tokens and rotating 30 day refresh tokens, BCrypt hashing, and CSRF middleware on every mutating route.

Client

React 18 and TypeScript on Vite, Tailwind, TanStack Query for server state, zustand for local state, @dnd-kit for drag-and-drop, and Recharts for the reporting views.

Realtime

A SignalR hub with per-project groups. Every audited mutation publishes a typed event that the client turns into a targeted TanStack Query invalidation, so the board updates without refetching the world.

The query I am most pleased with

Per-sprint velocity and a running total, in one pass.

Velocity needs two numbers per sprint: what closed inside that sprint, and the cumulative total across every sprint before it. An aggregate nested inside a window function gets both without a self-join or a second round trip.

SELECT
  s.name,
  COALESCE(SUM(i.story_points), 0) AS points_completed,
  SUM(COALESCE(SUM(i.story_points), 0))
    OVER (ORDER BY s.start_date ROWS UNBOUNDED PRECEDING) AS cumulative_points
FROM sprints s
LEFT JOIN issues i
  ON i.sprint_id = s.id
 AND i.closed_at IS NOT NULL
 AND i.closed_at <= s.end_date + INTERVAL '1 day'
WHERE s.project_id = @ProjectId
  AND s.status = 'completed'
GROUP BY s.id, s.name, s.start_date
ORDER BY s.start_date;

The closed_at <= end_date guard is the part that matters. Without it, closing an old ticket today would retroactively inflate a sprint that shipped last month.
A few other pieces of SQL worth calling out:

Reporting

Charts that only show what actually shipped.

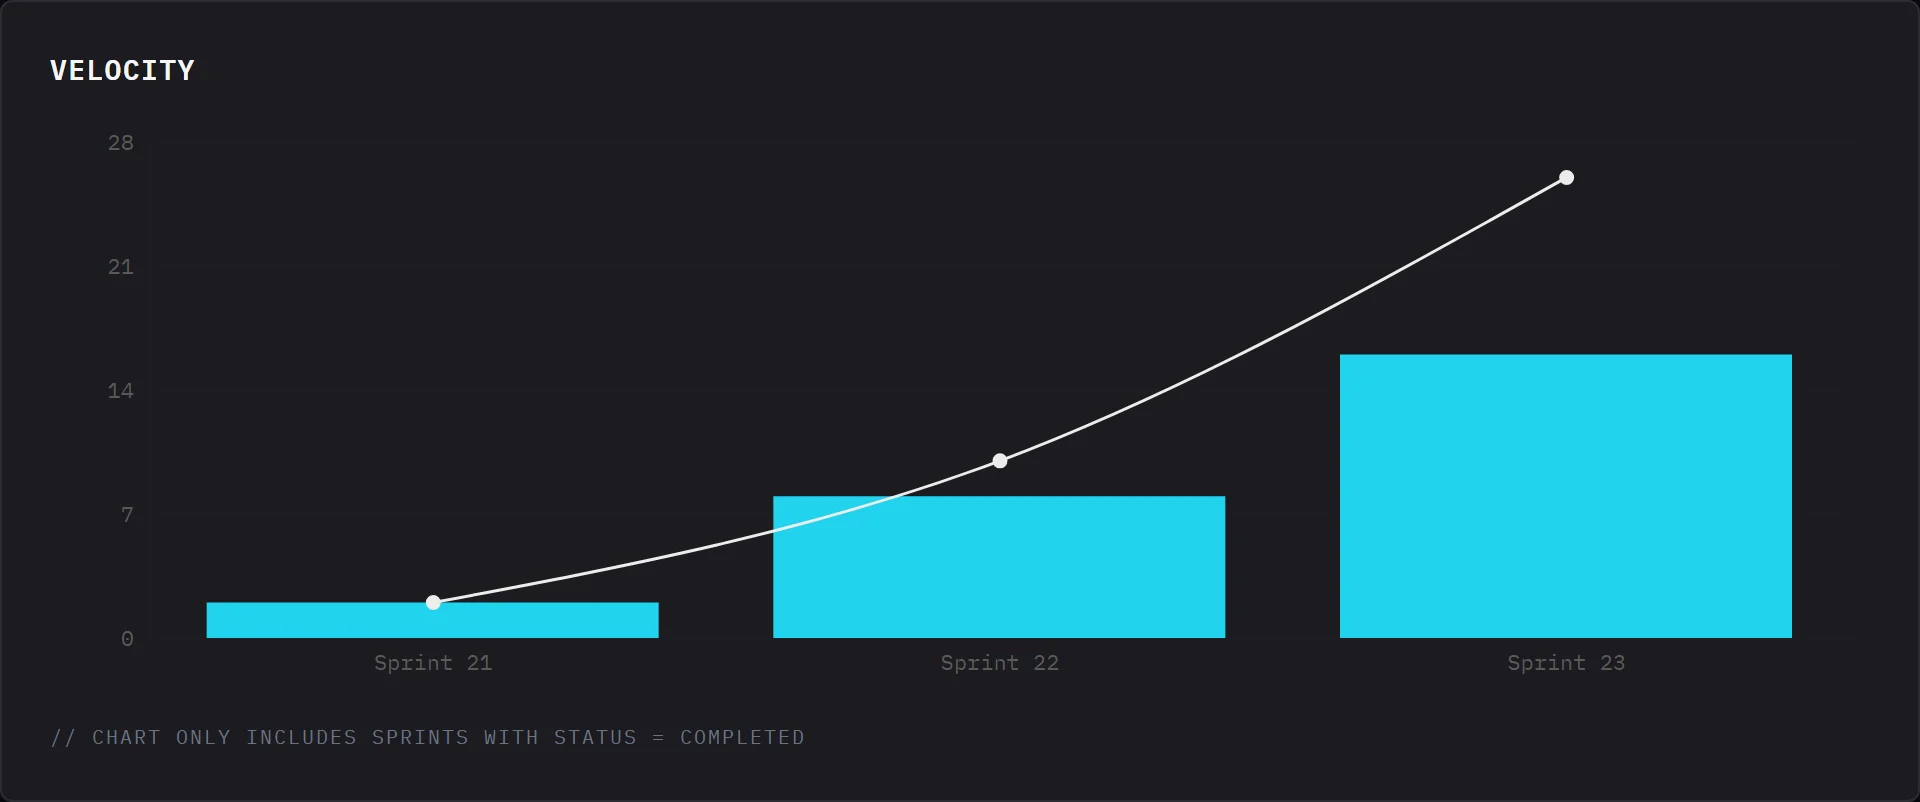
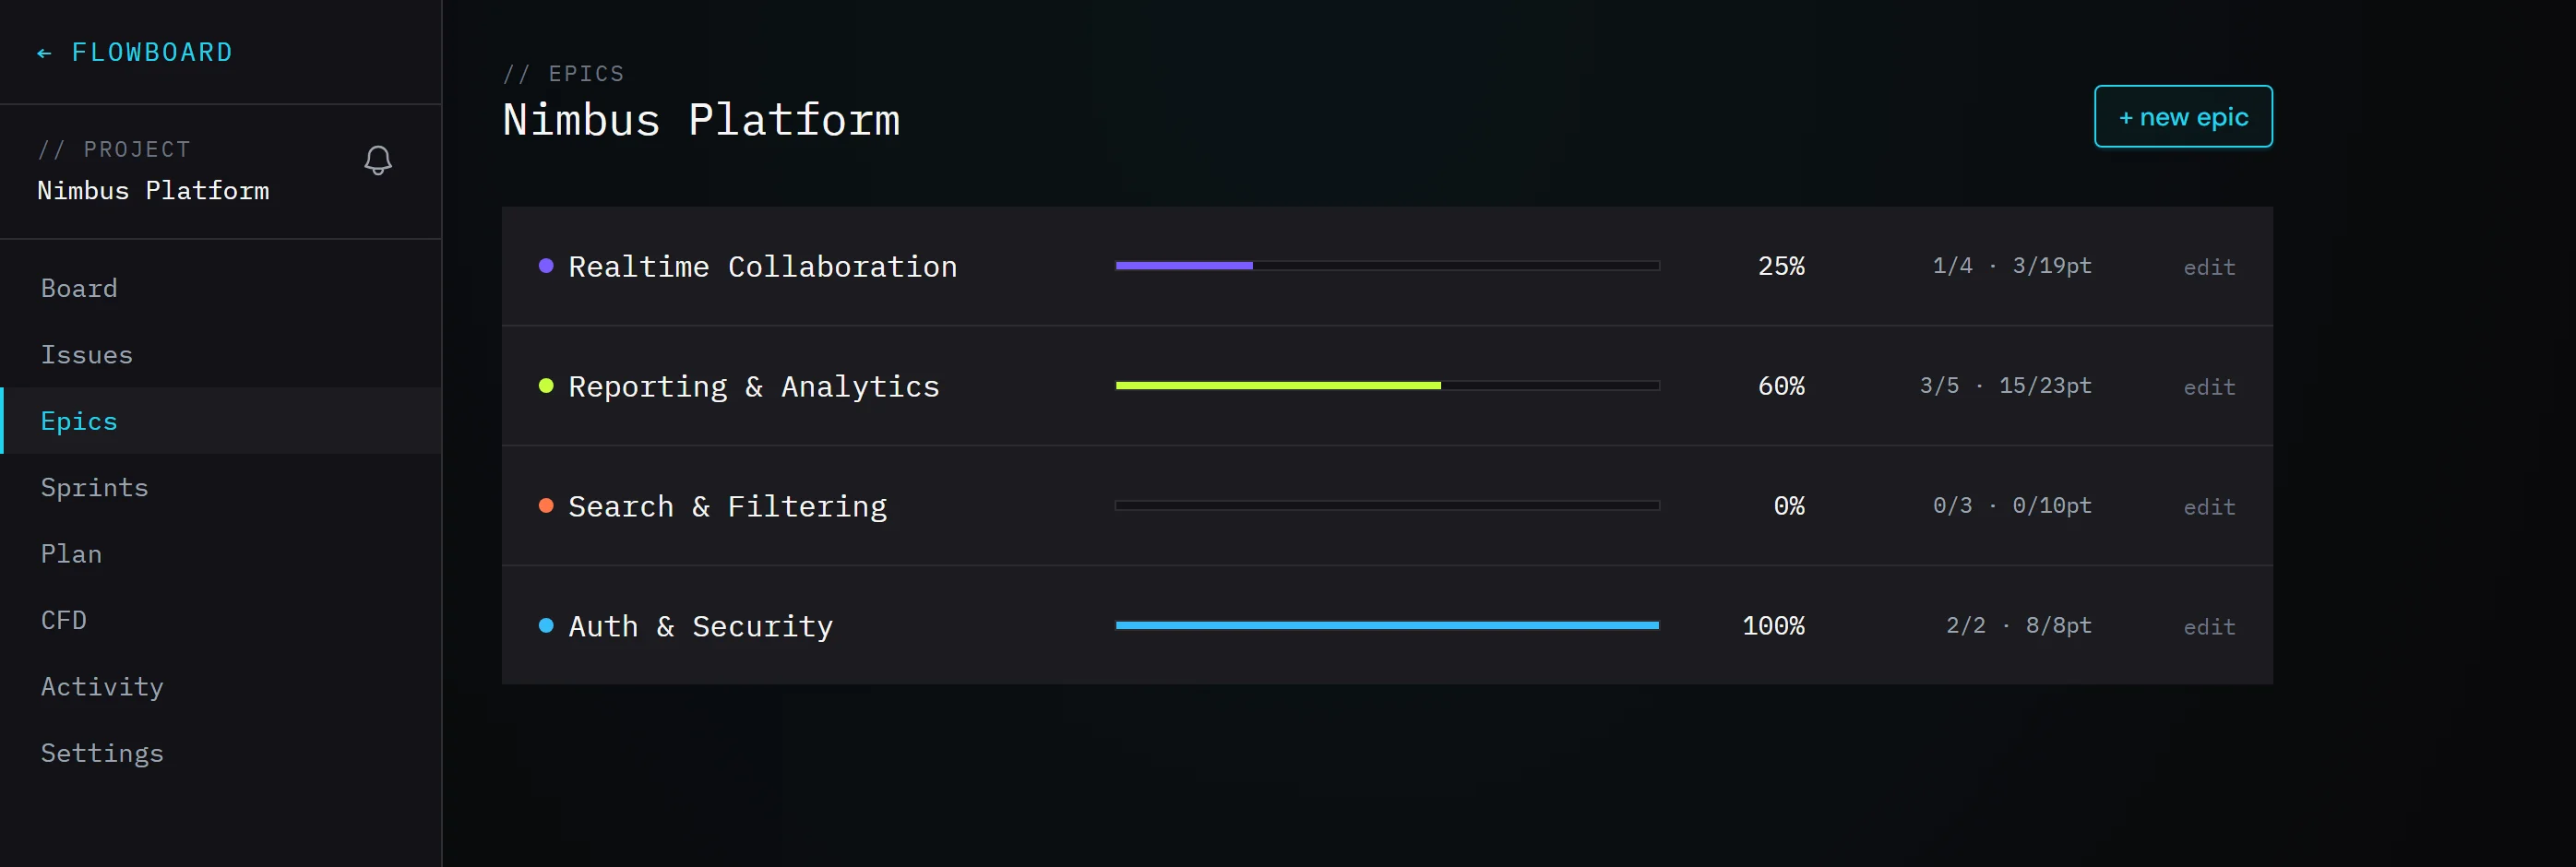
The velocity chart counts completed sprints only, and counts a story point on the day it closed rather than the day you look at it. Epics roll their progress up from their issues, so a 60% bar means sixty percent of the points, not sixty percent of the tickets.

Velocity chart with per-sprint bars and a cumulative line across three completed sprints
Velocity · per-sprint bars with a cumulative line
Epic list with colour-coded progress bars showing issues closed and points completed
Epics · progress measured in points, not ticket counts
Hindsight

What held up, and what I would change.

Read the code.

The repo includes the full schema, a documented walk-through of the trickier queries, and the xUnit and Playwright suites.

Open FlowBoard on GitHub