Stock Price Estimator — picking stocks that beat the market.
A machine-learning model that reads a company's quarterly report and recent
price history and predicts whether the stock will outperform the S&P 500
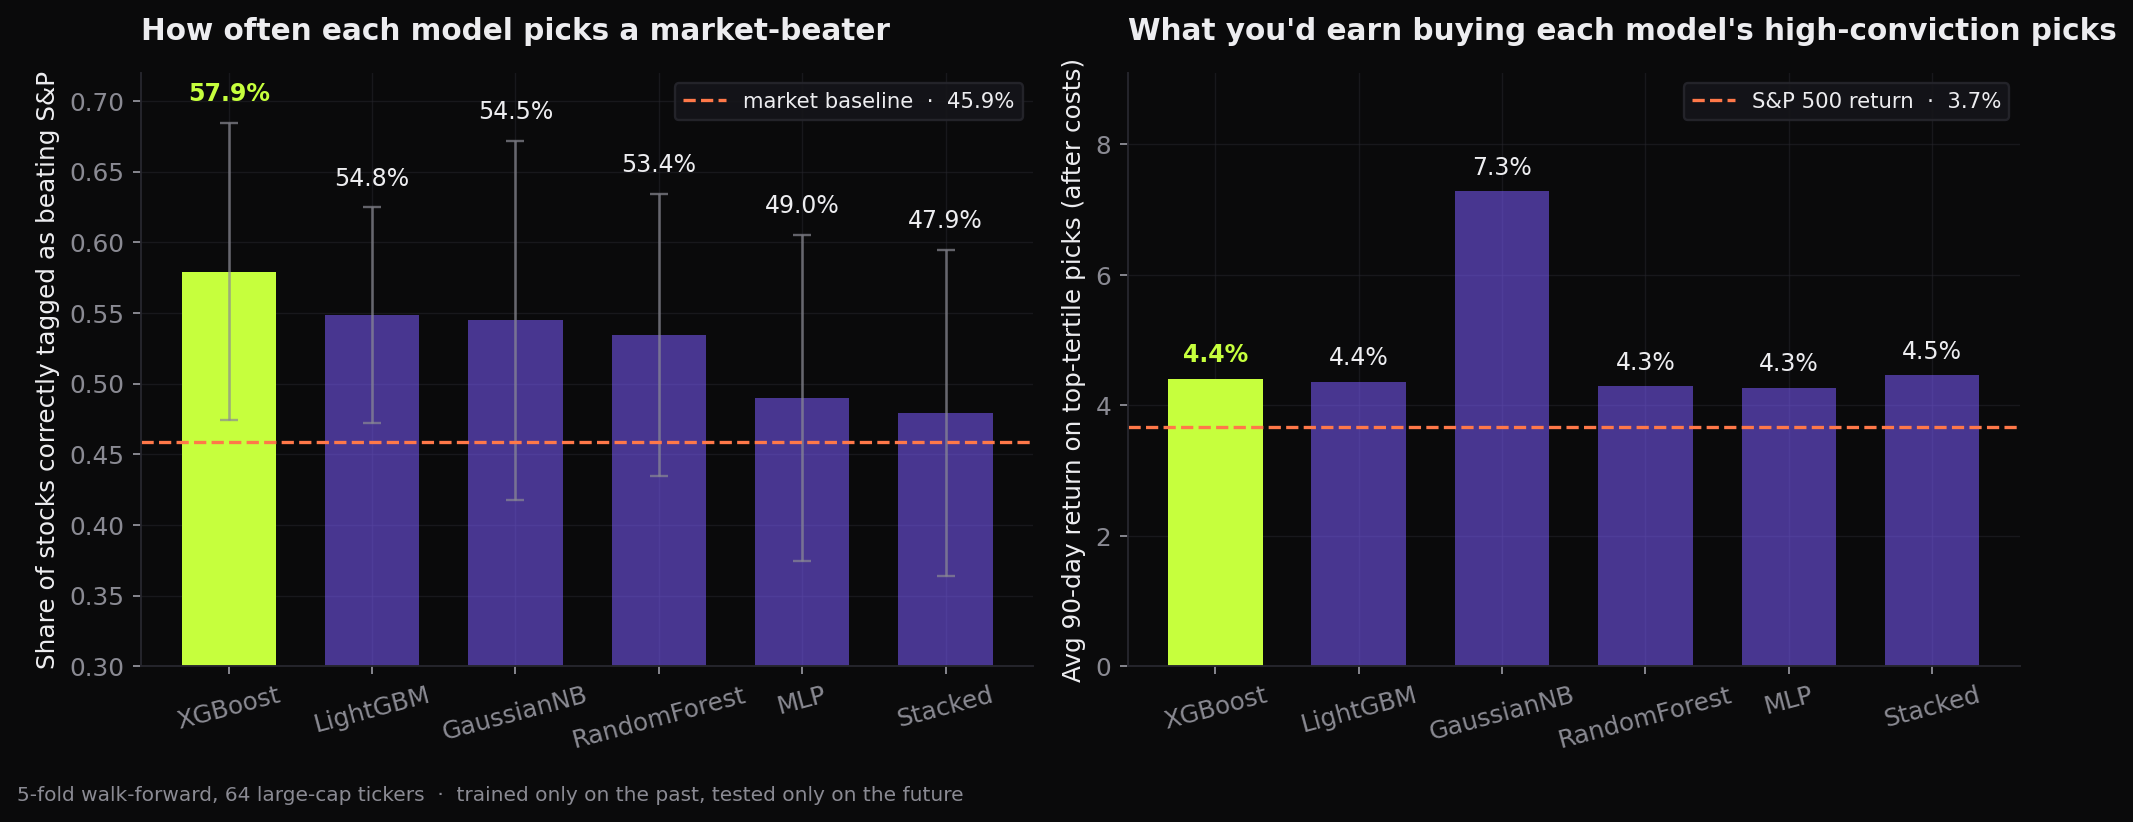
over the next 90 days. The current best model picks winners 57.9%
of the time against a 45.9% baseline, and its top picks
beat the index by an average of 3.6% per quarter in backtests.
Role
Solo · Data + ML
Status
v2 · open source
Stack
Python · XGBoost · LightGBM · SHAP · yfinance
Notable
Beats market baseline by 12 points · backtested with costs
Every public company files a quarterly report packed with numbers — revenue, margins,
debt, cash flow. The market reacts to all of it. The question this project asks is simple:
can a model read those numbers, plus how the stock has been moving recently, and tell
you which stocks are likely to beat the S&P 500 over the next three months?
The original college version of this project answered "will the stock go up?" — a
question that's roughly 54% "yes" by default, because most stocks rise most of the time.
Reframing it as "will it beat the market?" makes the bar much harder and the answer much
more useful: only about 46% of stocks beat the index in any given quarter,
so anything meaningfully above that is real signal.
Approach
Mix company health with market behavior.
For 64 large-cap U.S. companies, the model gets two kinds of signals at the moment of
each earnings release:
Company health
17 ratios from the latest quarterly report: profit margins, return on assets, debt levels, cash flow quality, year-over-year revenue growth. Standardized so a tech company and a bank are on the same scale.
Market behavior
How the stock and the broader market have been moving: 3, 6, and 12 month returns leading up to the filing, recent volatility, and the same for the S&P 500 — so the model knows whether we're in a calm or stormy regime.
Honest evaluation
Trained only on the past, tested only on the future. Five chronological folds; no test-set information ever leaks into training. Probabilities are calibrated, and a long-only backtest charges 10 basis points per round-trip trade.
Six models compete head-to-head: a Naive Bayes baseline,
a small neural net, a Random Forest, XGBoost, LightGBM, and a stacked ensemble that
combines the top three through logistic regression. SHAP is used afterward to confirm
the model is leaning on sensible features, not pattern-matching on noise.
Outcome
The model beats the market baseline.
XGBoost is the strongest of the six, picking stocks that beat the S&P
57.9% of the time — a 12-point edge over the 45.9% baseline.
When you actually buy the model's top-tertile picks each quarter, they earn an
average of 4.4% over the next 90 days versus 3.7%
for the index over the same window, even after accounting for trading costs.
XGBoost
57.9%
Accuracy at picking stocks that beat the S&P, vs. a 45.9% baseline.
Top-tertile picks
+4.4%
Average 90-day return on the model's most confident buys, after costs (SPY: +3.7%).
Hit rate on top picks
62.1%
Share of high-confidence picks that finished the quarter in positive territory.
SHAP confirms the model is leaning on sensible signals:
recent price momentum, company size, the
market's volatility regime, relative strength versus the index,
and balance-sheet leverage. The combination of fundamentals and momentum
is what carries the signal — fundamentals alone weren't enough.
What I learned
The lessons that moved the needle.
Frame the question against a real benchmark. Asking "will it go up?" is too easy — most stocks go up. Asking "will it beat the index?" is the right bar, and the one a real investor cares about.
How you split the data matters more than which model you pick. The original version used random splits and looked great because the model was secretly seeing the future. Switching to strictly chronological splits told the truth.
Fundamentals alone aren't enough; momentum closes the gap. Adding recent price behavior and market context lifted accuracy from "barely above chance" to "clearly above the baseline," without leaking any information from the future.
The interesting metric isn't accuracy — it's what happens when you act on the predictions. The model's top-tertile picks beat the S&P 500 in backtests after trading costs, which is the version of "good" that actually matters.
Next pass: deeper history (10+ years, more tickers), sector-relative ranking, real Sharpe ratio reporting, and a hosted demo where you can paste a ticker and see the model's call.
Read the v2 writeup.
Full reproduction steps, per-fold metrics, SHAP importances, and the original v1 code all live in the repo.